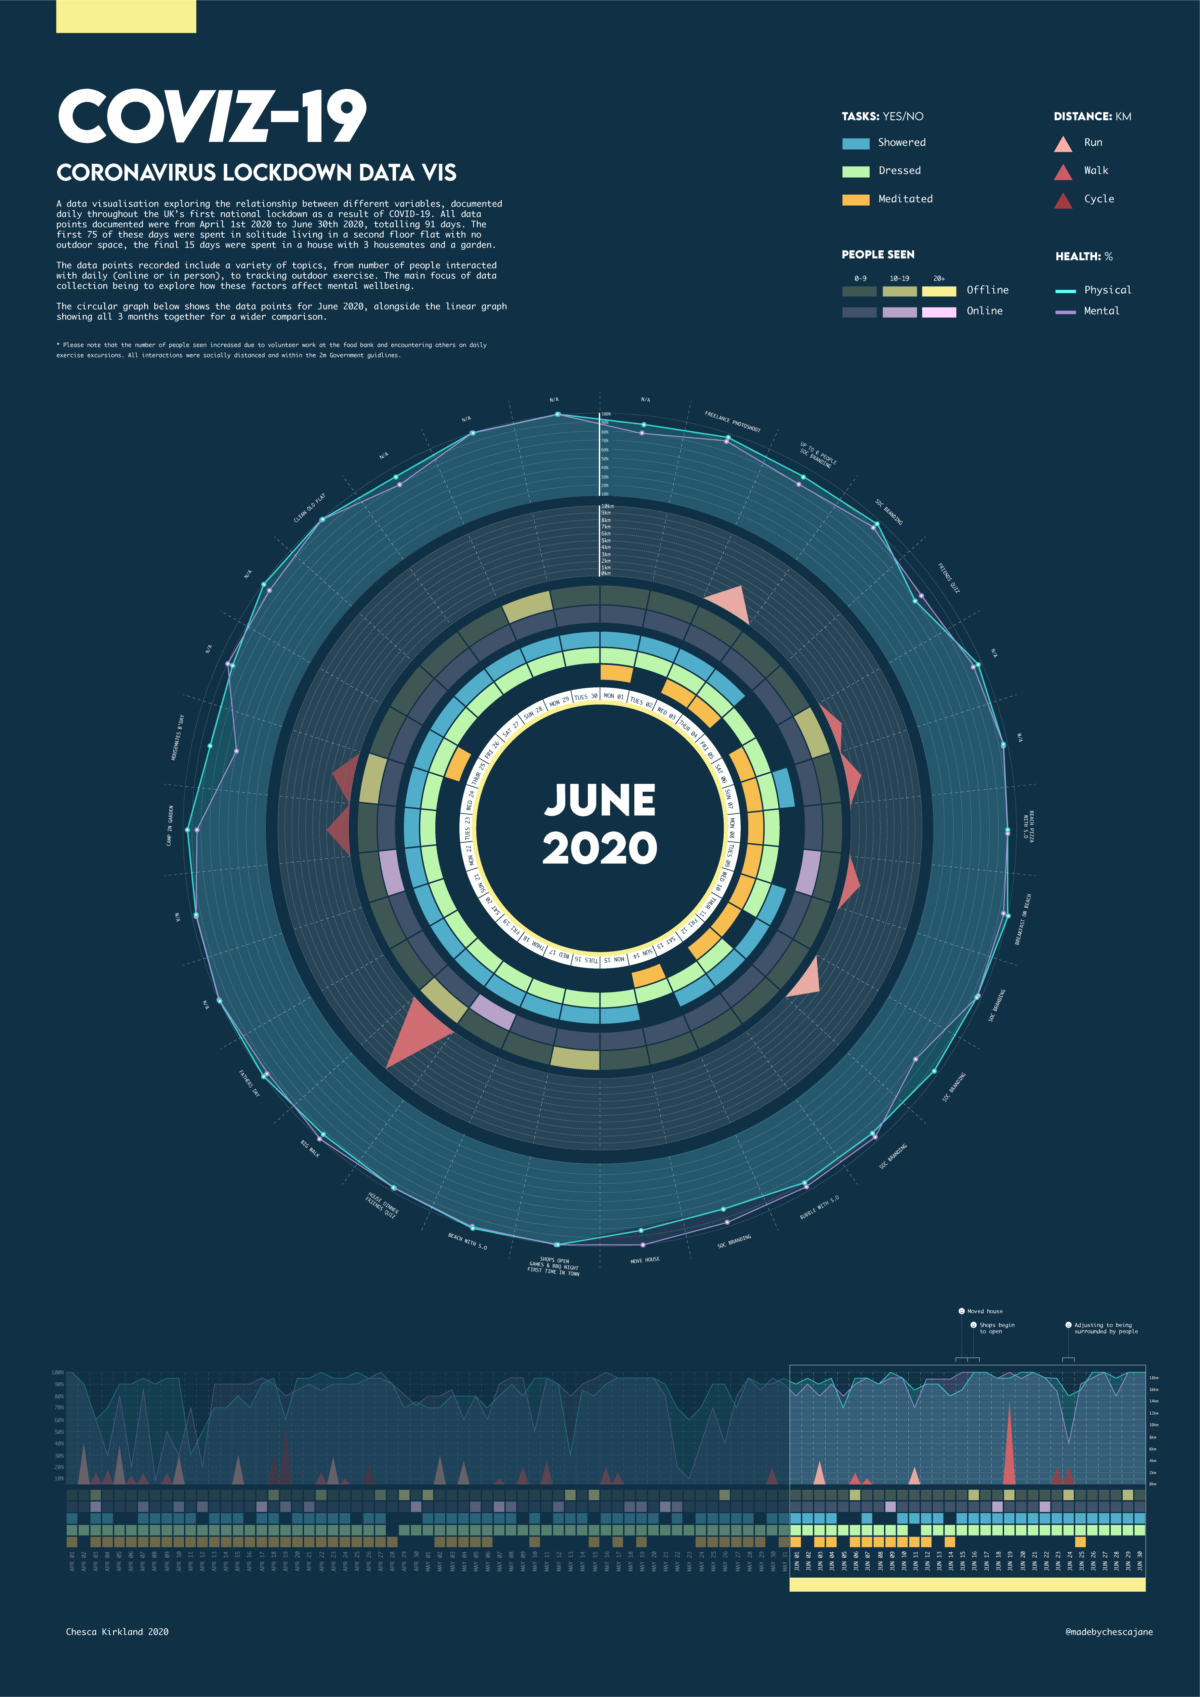
Chesca Kirkland recorded her life during lockdown, things about her daily activities such as how many showers she took, whether or not she meditated or how many people she meet. After that she created this series of infographics to represent those activities in a visual and more inmediate form. It is amazing how data visualization can give us another perspective into our lives, maybe more precise and empirical than our working memory, which usually tends to forget recent events.
You can check out her full story here


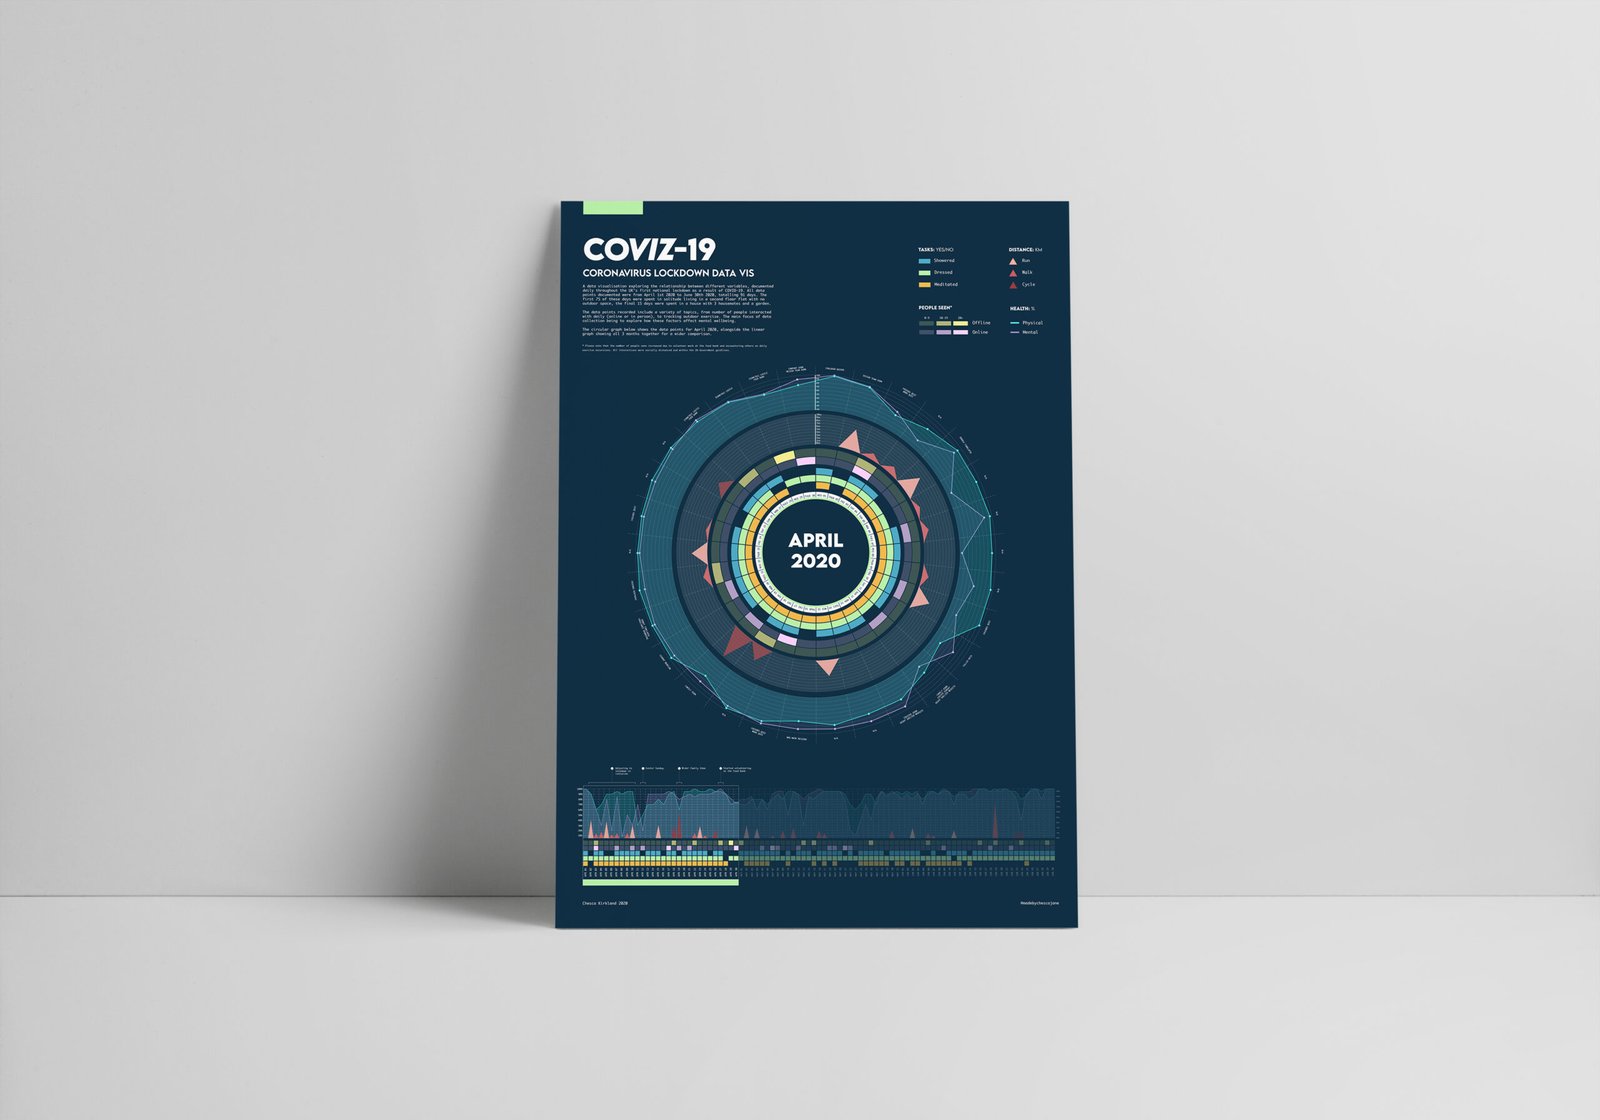
Infographics Data Viz lockdown